63 lines
2.7 KiB
Markdown
63 lines
2.7 KiB
Markdown
# Spring sleuth setup
|
|
Spring Sleuth provides Spring Boot auto-configuration for distributed tracing. Skywalking integrates it's micrometer part,
|
|
and it can send metrics to the Skywalking [Meter System](./../../concepts-and-designs/meter.md).
|
|
|
|
## Set up agent
|
|
|
|
1. Add the Micrometer and Skywalking meter registry dependency into project `pom.xml` file. Also you could found more detail at [Toolkit micrometer](./../service-agent/java-agent/Application-toolkit-micrometer.md).
|
|
```xml
|
|
<dependency>
|
|
<groupId>org.springframework.boot</groupId>
|
|
<artifactId>spring-boot-starter-actuator</artifactId>
|
|
</dependency>
|
|
<dependency>
|
|
<groupId>org.apache.skywalking</groupId>
|
|
<artifactId>apm-toolkit-micrometer-registry</artifactId>
|
|
<version>${skywalking.version}</version>
|
|
</dependency>
|
|
```
|
|
|
|
2. Create the Skywalking meter resgitry into spring bean management.
|
|
```java
|
|
@Bean
|
|
SkywalkingMeterRegistry skywalkingMeterRegistry() {
|
|
// Add rate configs If you need, otherwise using none args construct
|
|
SkywalkingConfig config = new SkywalkingConfig(Arrays.asList(""));
|
|
return new SkywalkingMeterRegistry(config);
|
|
}
|
|
```
|
|
|
|
## Set up backend receiver
|
|
|
|
1. Enable meter receiver in the `applicaiton.yml`.
|
|
```yaml
|
|
receiver-meter:
|
|
selector: ${SW_RECEIVER_METER:default}
|
|
default:
|
|
```
|
|
|
|
2. Configure the meter config file, It already has the [spring sleuth meter config](../../../../oap-server/server-bootstrap/src/main/resources/meter-receive-config/spring-sleuth.yaml).
|
|
If you also has some customized meter at the agent side, please read [meter document](backend-meter.md#meters-configure) to configure meter.
|
|
|
|
## Add UI dashboard
|
|
|
|
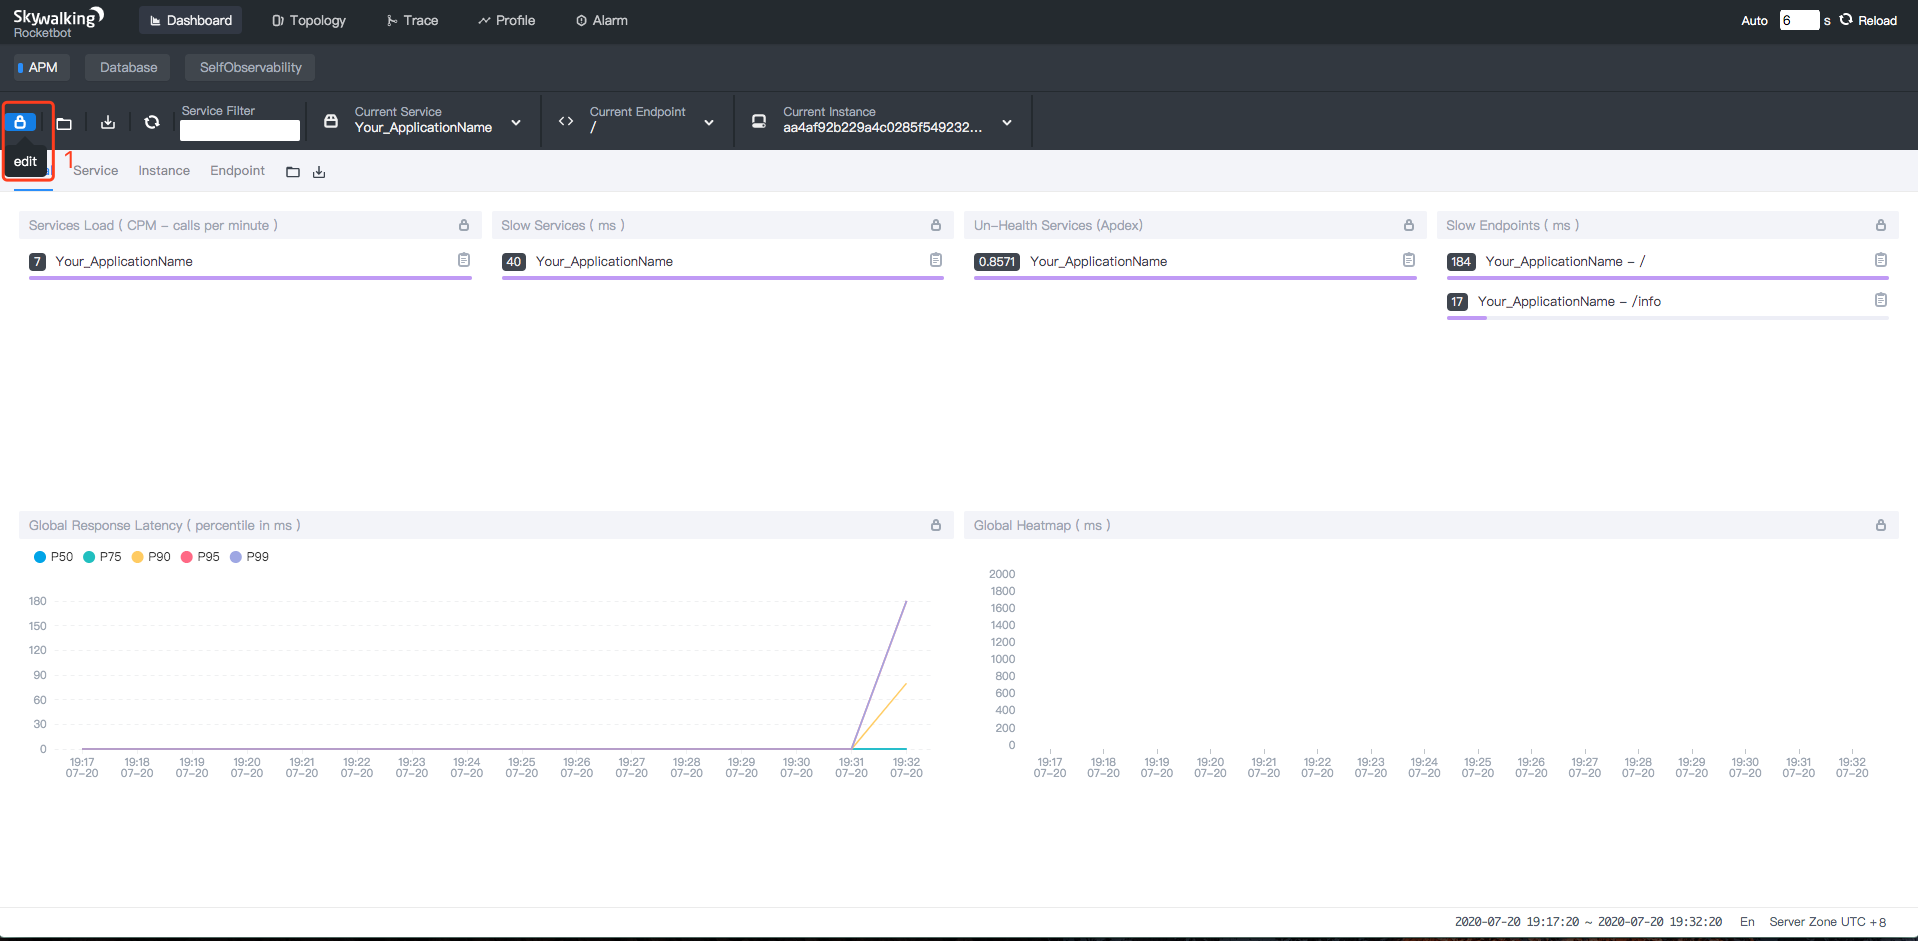
1. Open the dashboard view, click `edit` button to edit the templates.
|
|
|
|
|
|
|
|
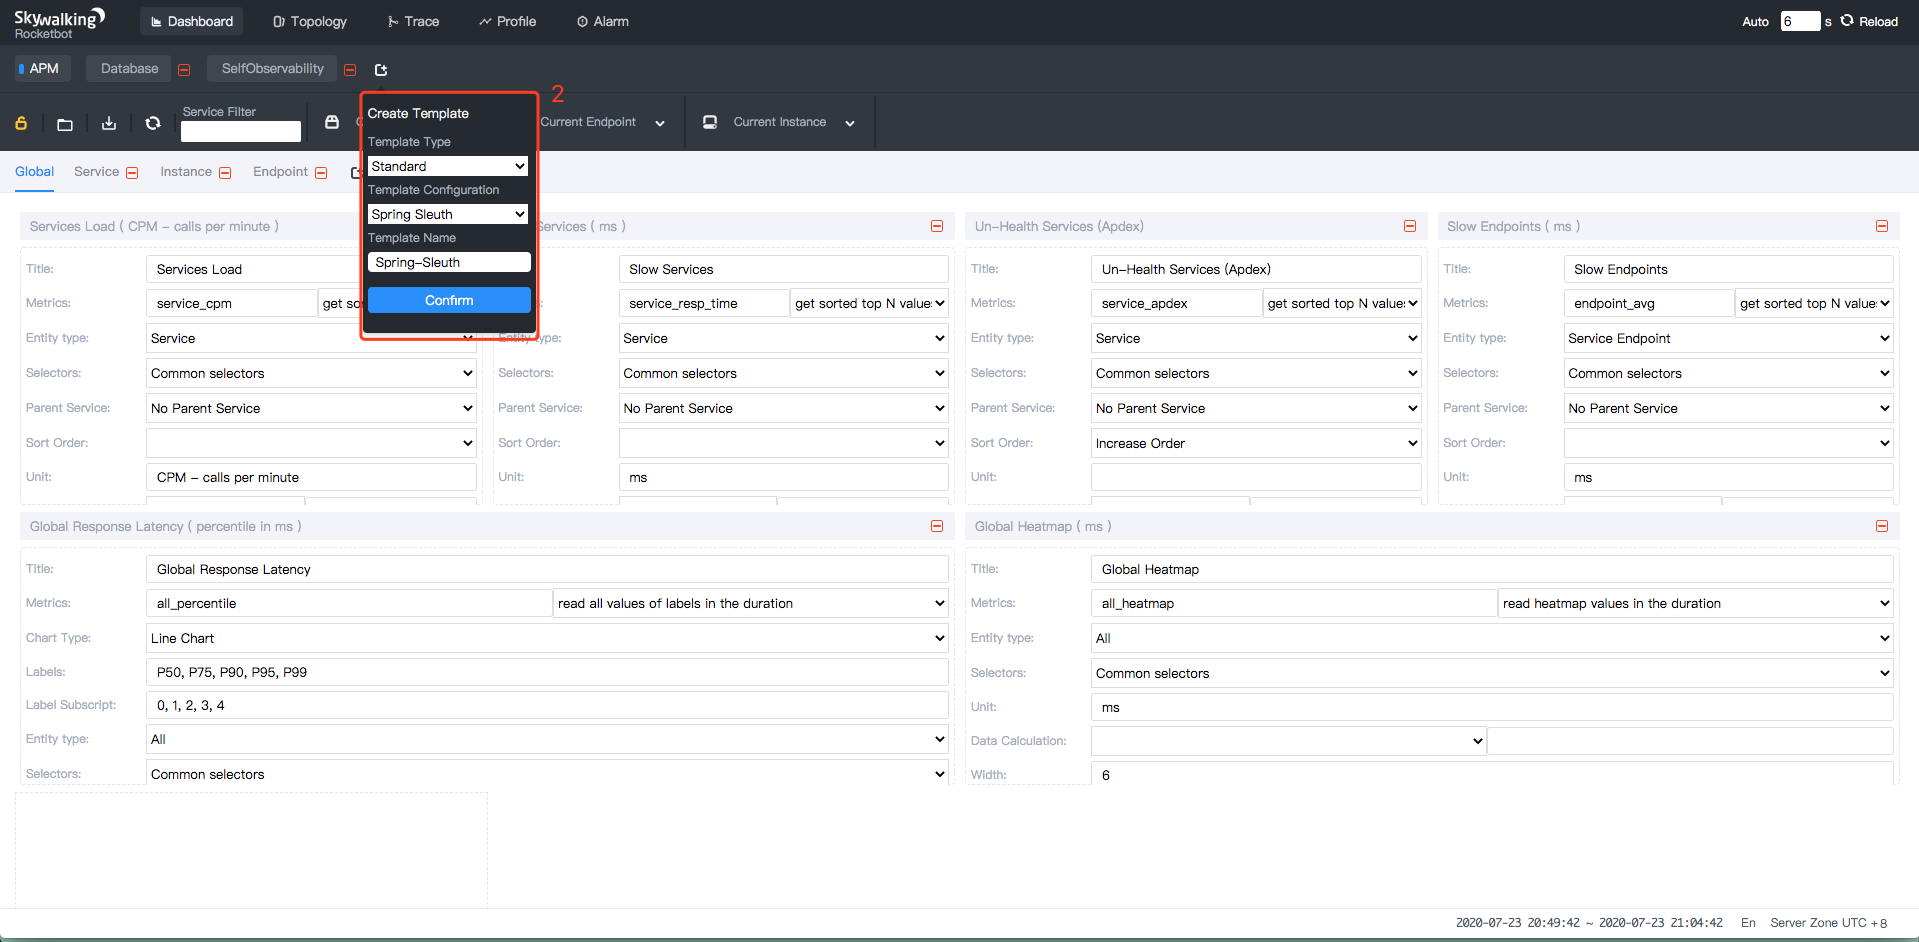
1. Create a new template. Template type: `Standard` -> Template Configuration: `Spring` -> Input the Template Name.
|
|
|
|
|
|
|
|
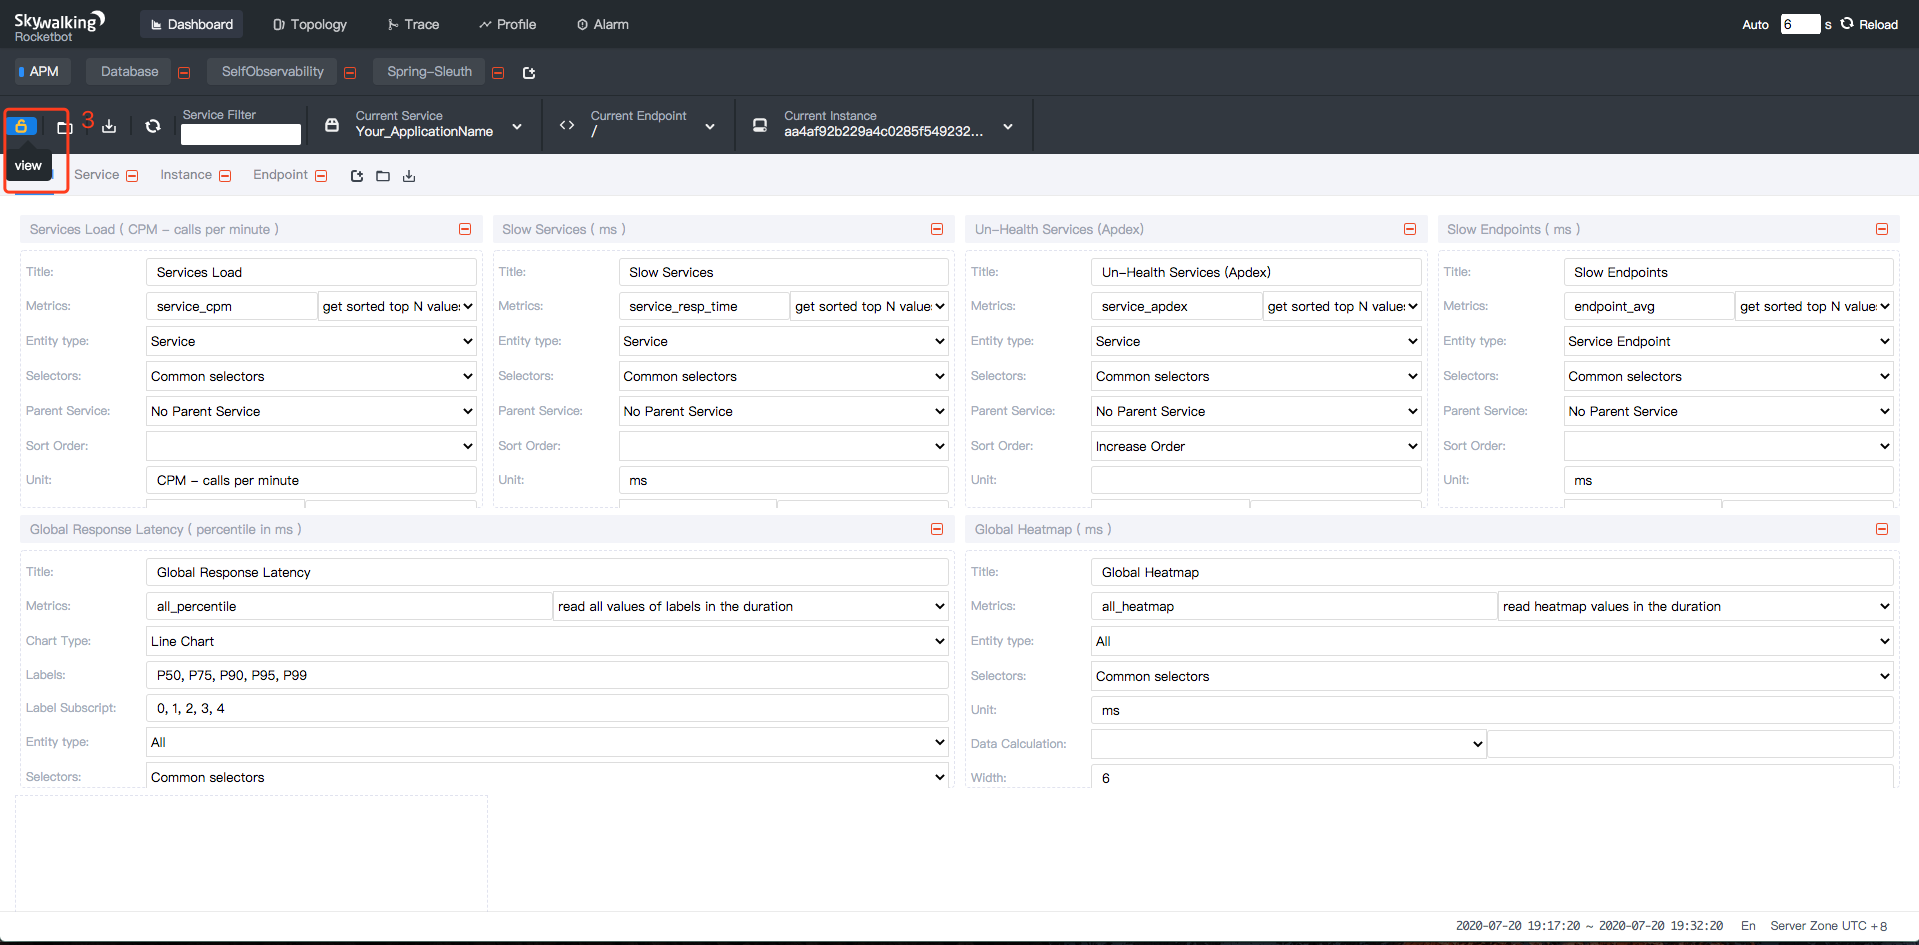
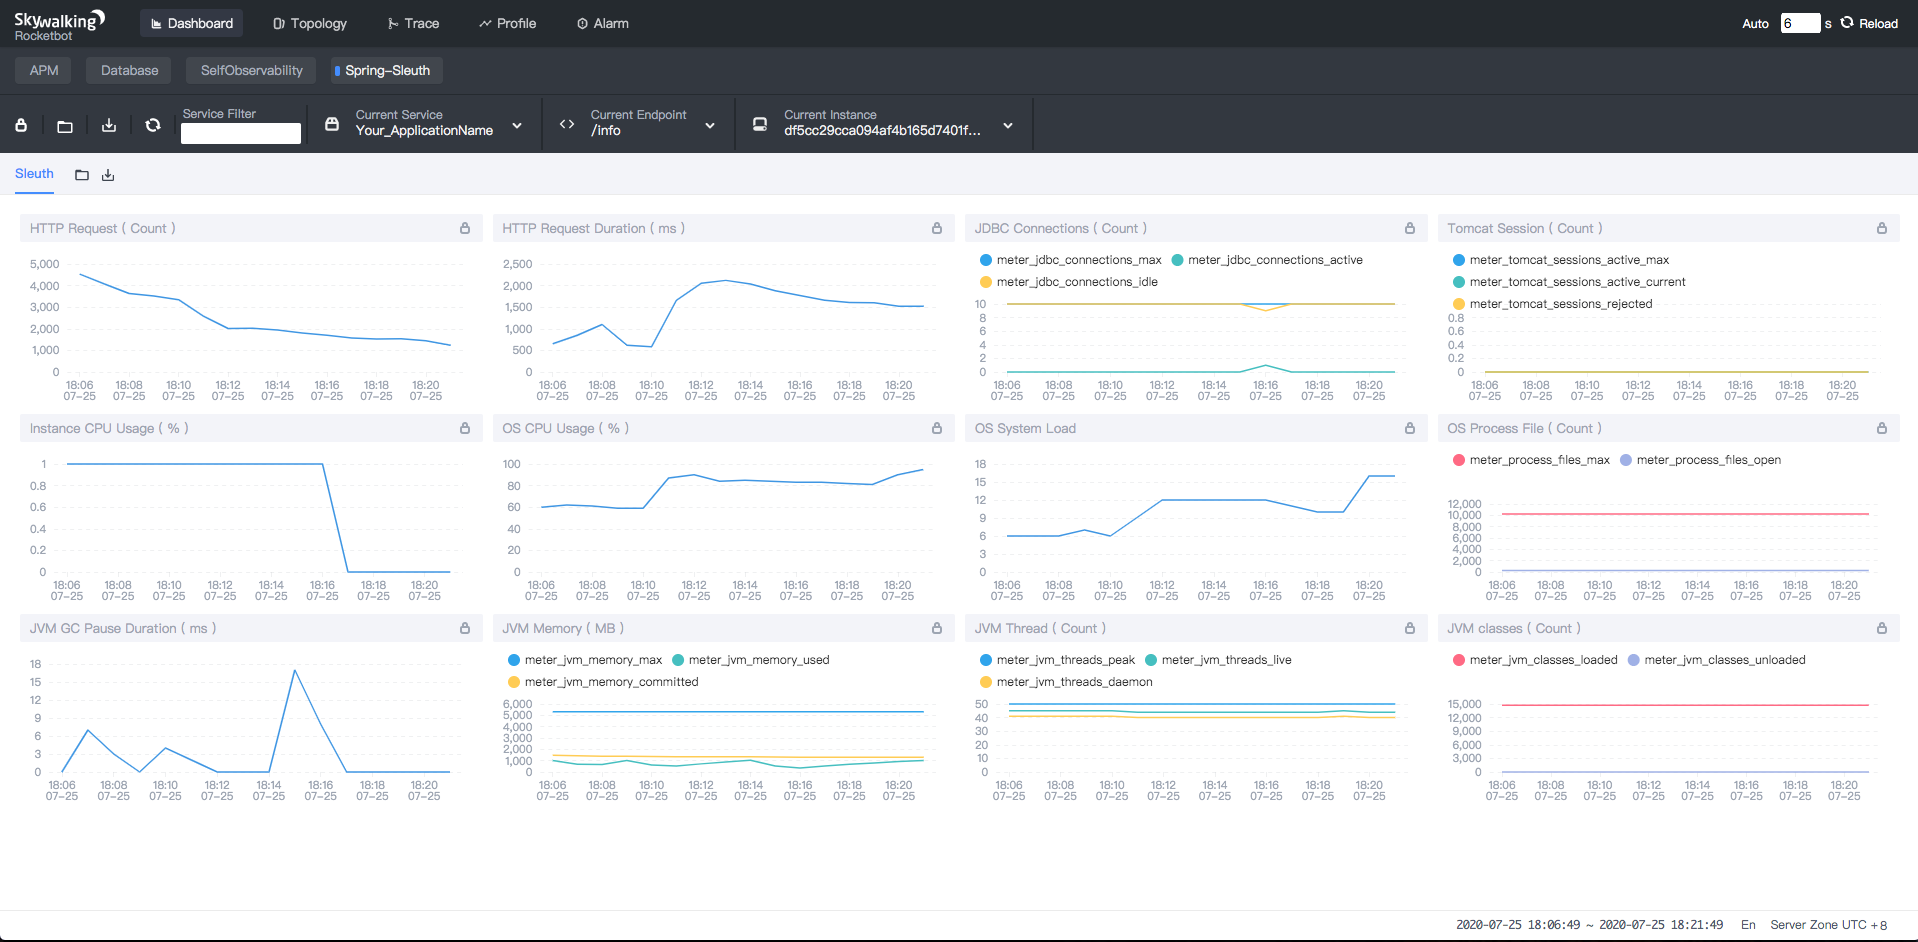
1. Click `view` button, Finally get the spring sleuth dashboard.
|
|
|
|
|
|
|
|
|
|
## Supported meter
|
|
|
|
Supported 3 types information: Application, System, JVM.
|
|
|
|
1. Application: HTTP request count and duration, JDBC max/idle/active connection count, Tomcat session active/reject count.
|
|
1. System: CPU system/process usage, OS System load, OS Process file count.
|
|
1. JVM: GC pause count and duration, Memory max/used/committed size, Thread peak/live/daemon count, Classes loaded/unloaded count. |