2.7 KiB
2.7 KiB
Spring sleuth setup
Spring Sleuth provides Spring Boot auto-configuration for distributed tracing. Skywalking integrates it's micrometer part, and it can send metrics to the Skywalking Meter System.
Set up agent
- Add the Micrometer and Skywalking meter registry dependency into project
pom.xmlfile. Also you could found more detail at Toolkit micrometer.
<dependency>
    <groupId>org.springframework.boot</groupId>
    <artifactId>spring-boot-starter-actuator</artifactId>
</dependency>
<dependency>
    <groupId>org.apache.skywalking</groupId>
    <artifactId>apm-toolkit-micrometer-registry</artifactId>
    <version>${skywalking.version}</version>
</dependency>
- Create the Skywalking meter resgitry into spring bean management.
@Bean
SkywalkingMeterRegistry skywalkingMeterRegistry() {
    // Add rate configs If you need, otherwise using none args construct
    SkywalkingConfig config = new SkywalkingConfig(Arrays.asList(""));
    return new SkywalkingMeterRegistry(config);
}
Set up backend receiver
- Make sure enable meter receiver in the
applicaiton.yml.
receiver-meter:
  selector: ${SW_RECEIVER_METER:default}
  default:
- Configure the meter config file, It already has the spring sleuth meter config. If you also has some customized meter at the agent side, please read meter document to configure meter.
Add UI dashboard
-
Open the dashboard view, click
editbutton to edit the templates.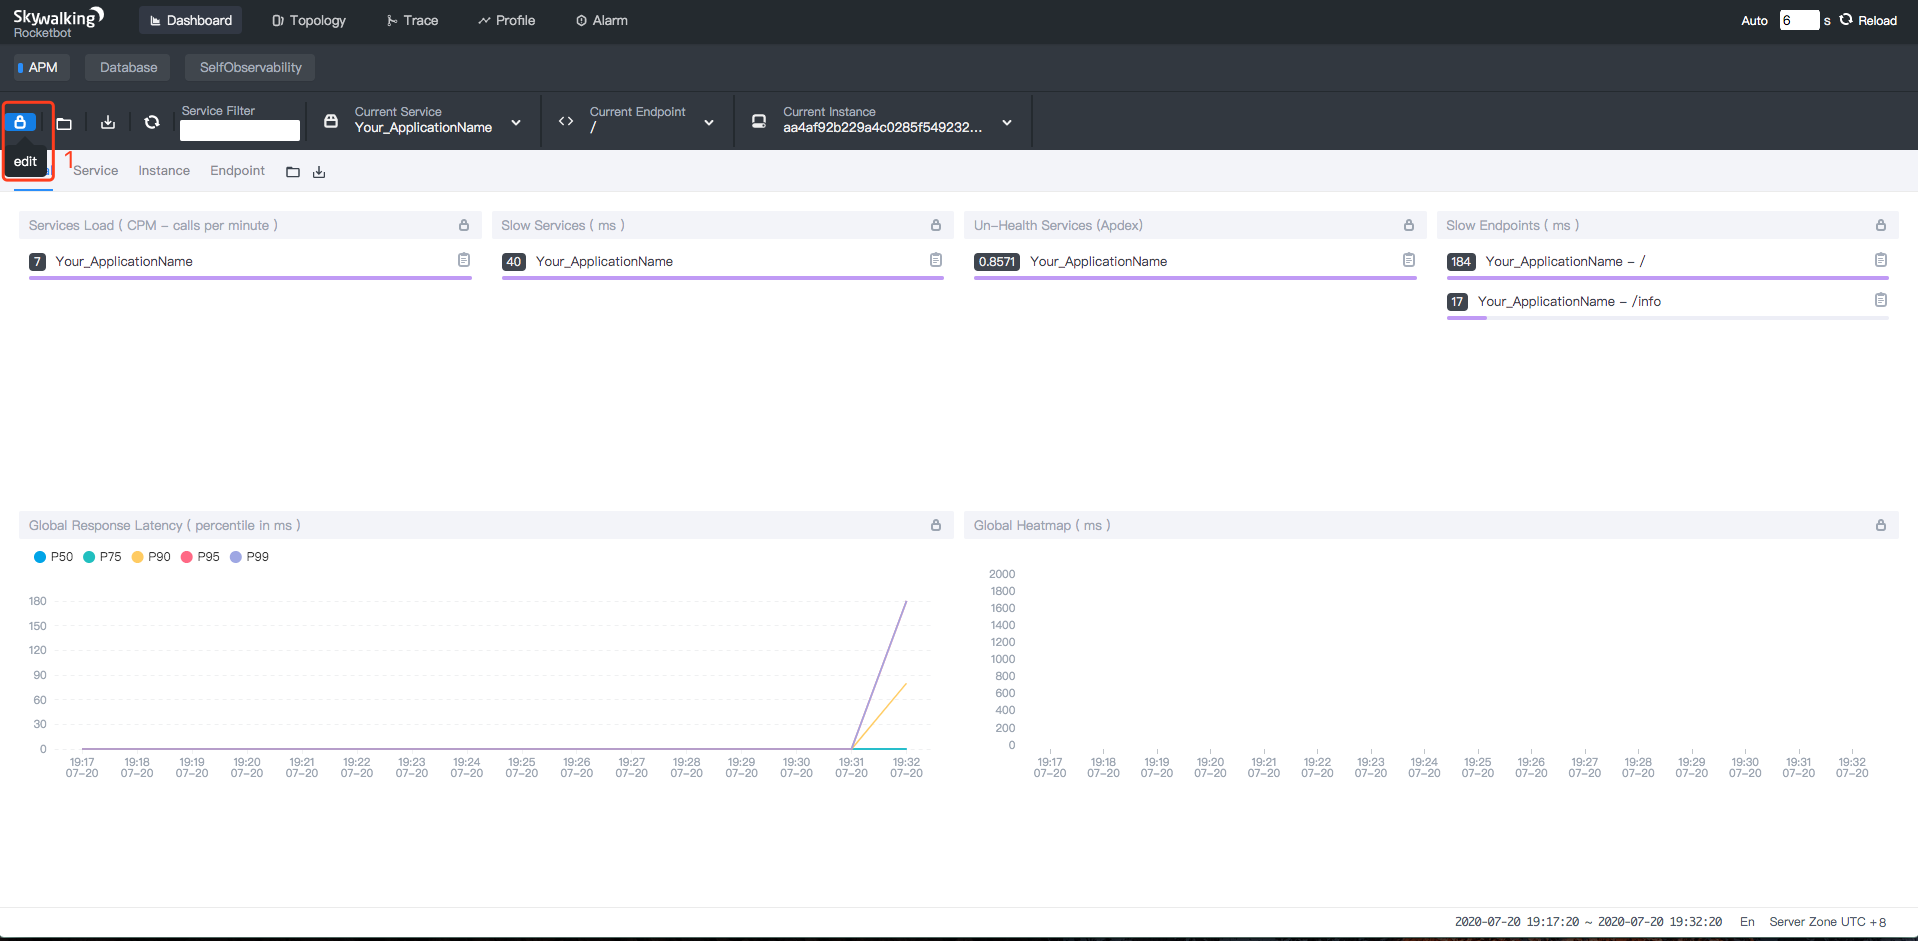
-
Create a new template. Template type:
Standard-> Template Configuration:Spring-> Input the Template Name.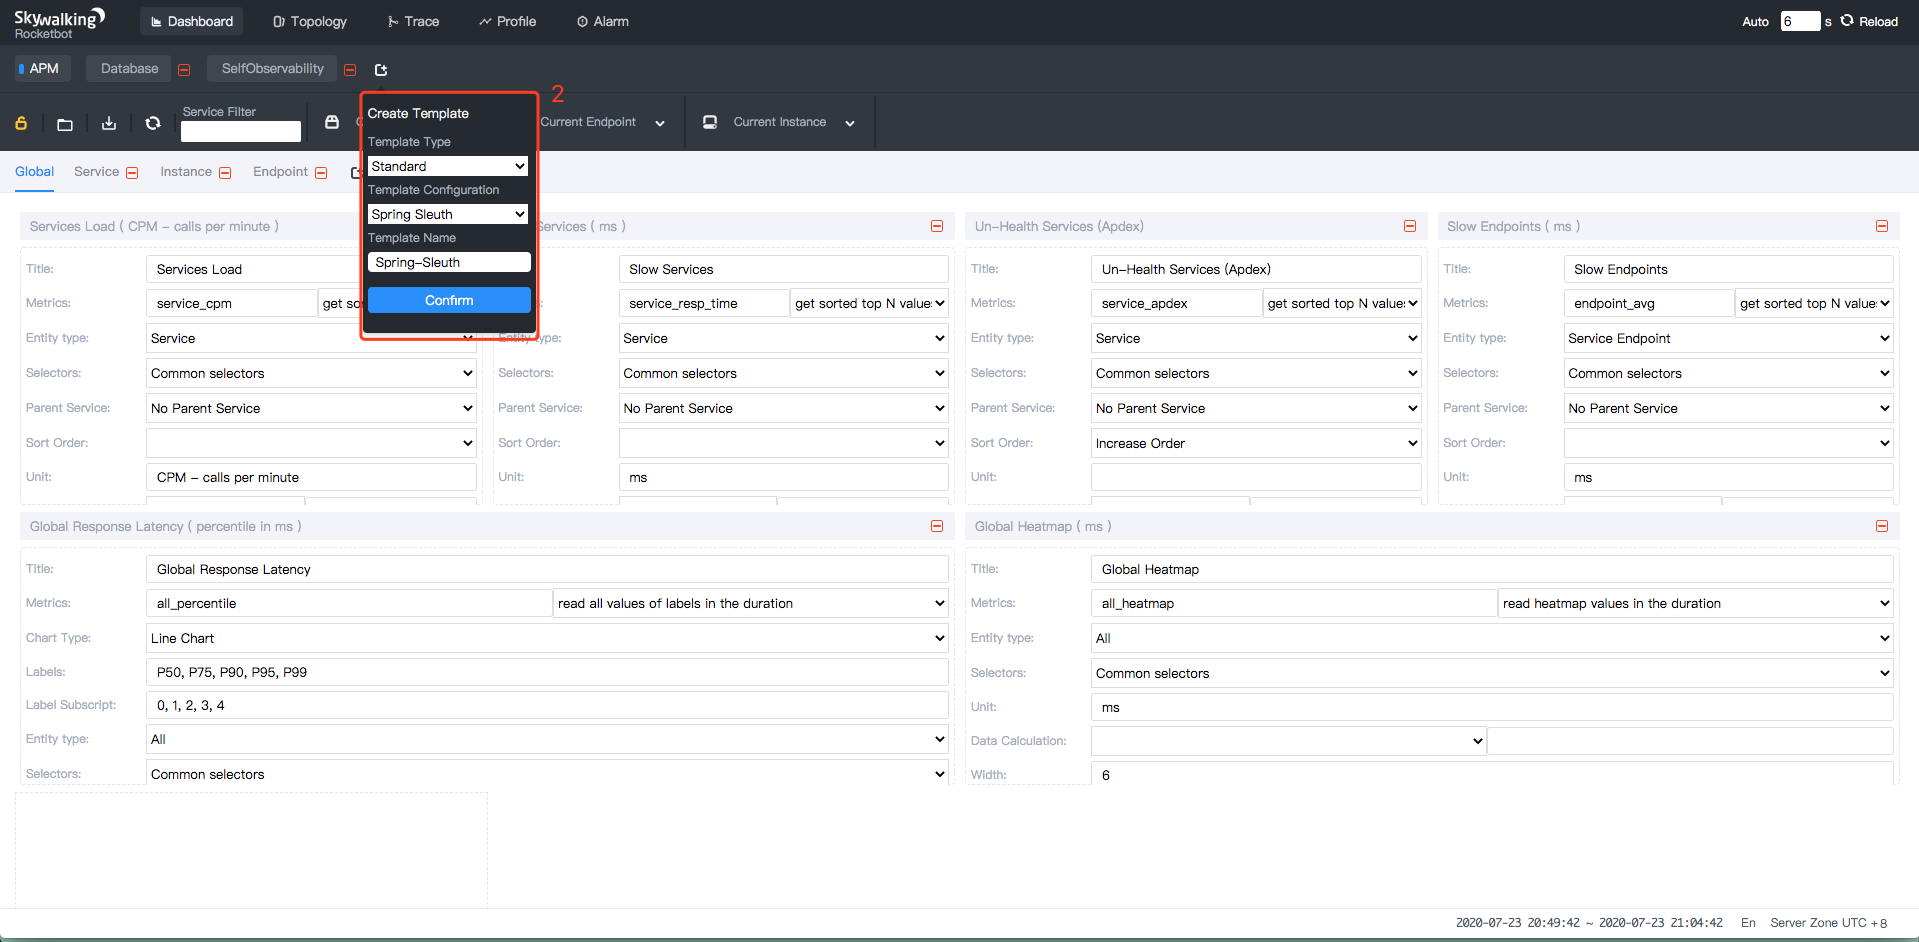
-
Click
viewbutton, Finally get the spring sleuth dashboard.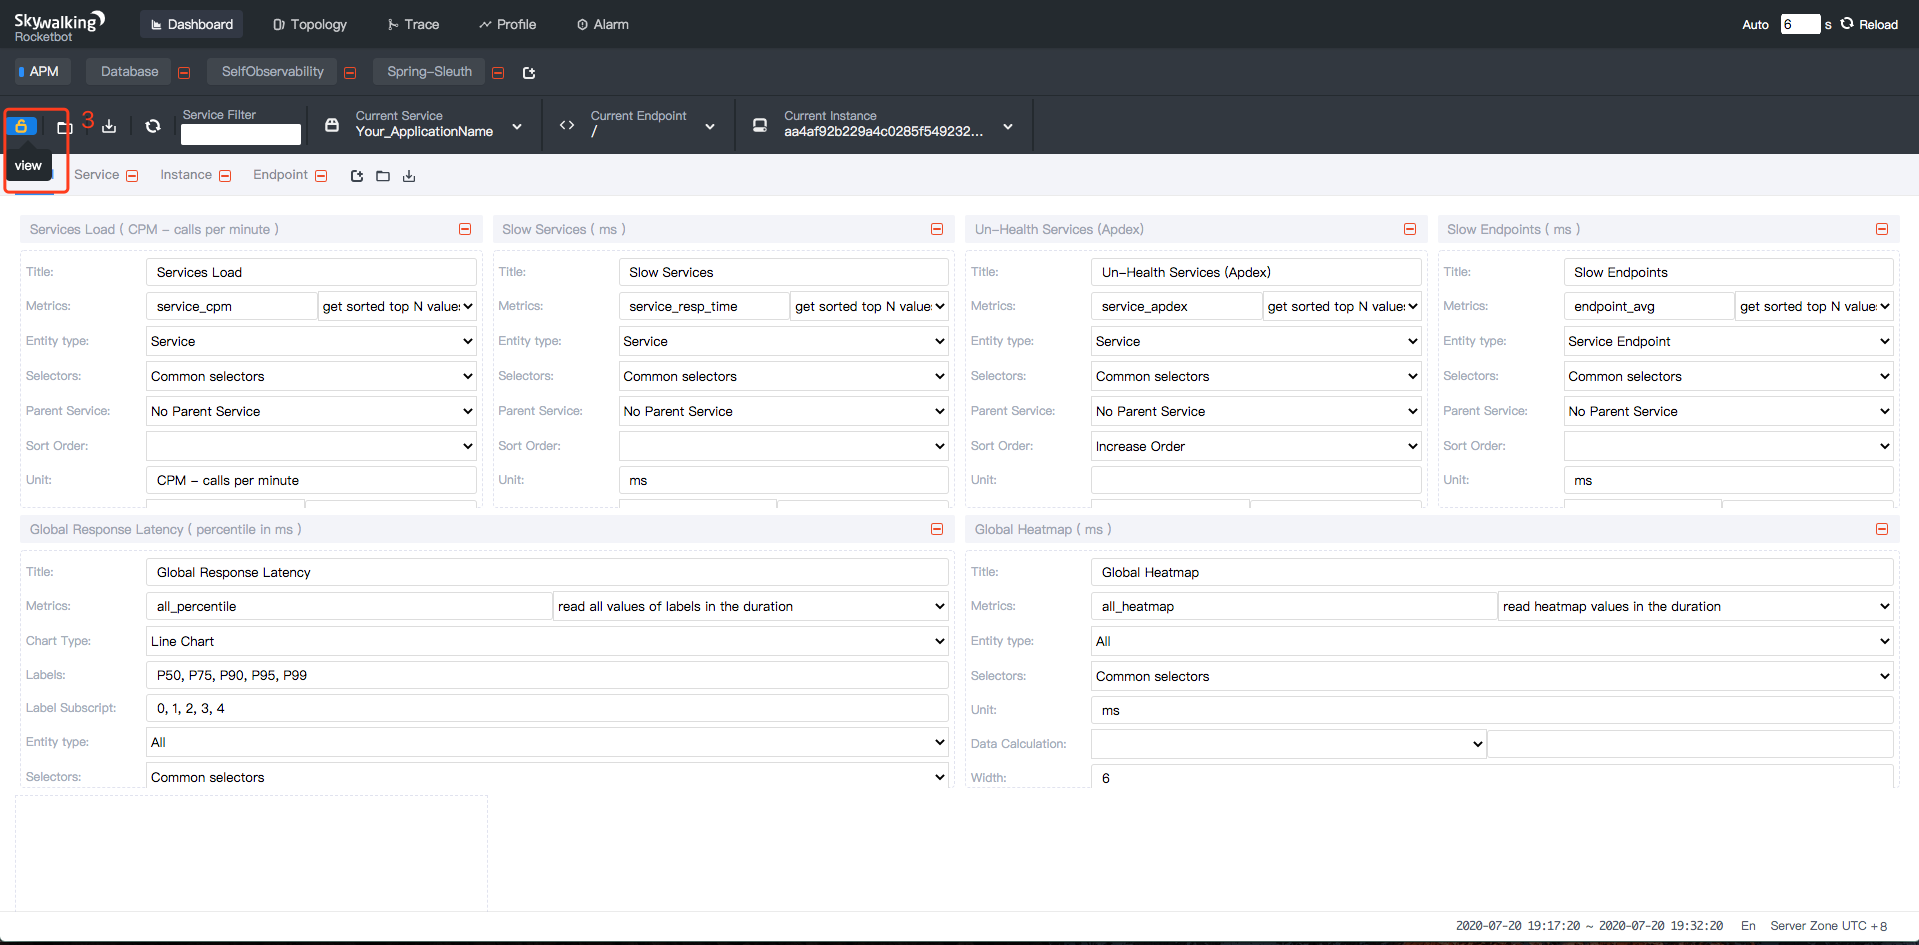
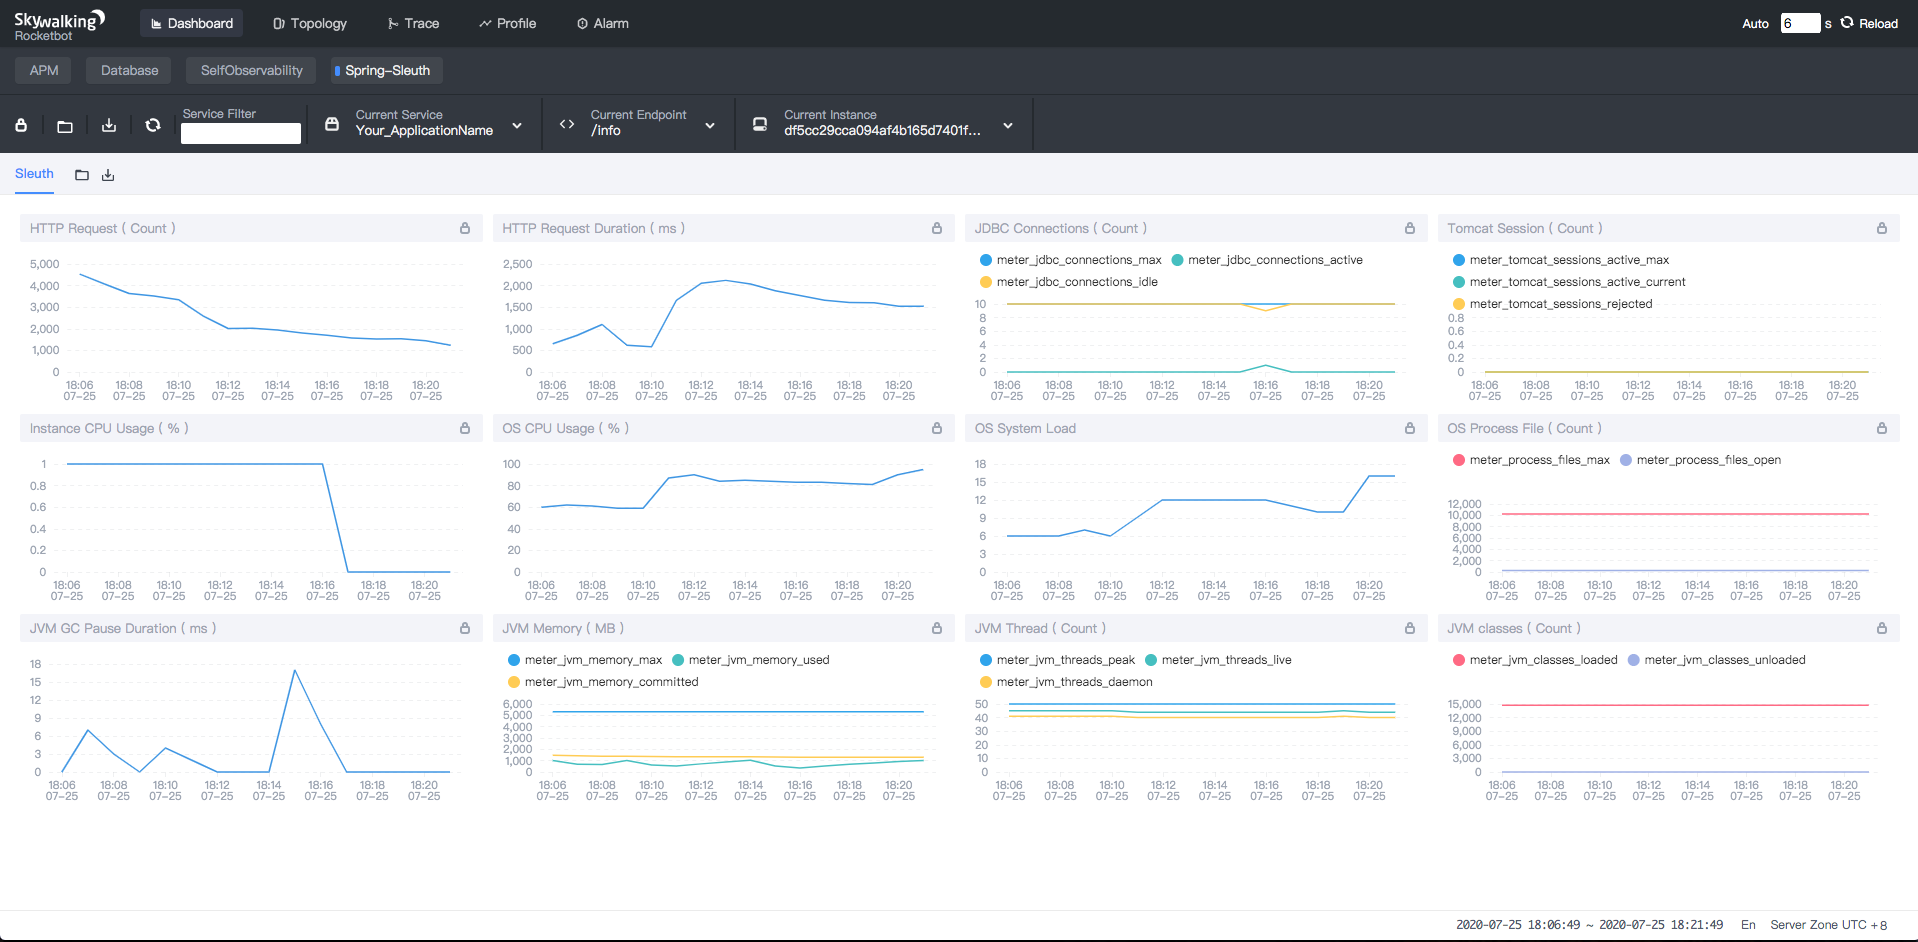
Supported meter
Supported 3 types information: Application, System, JVM.
- Application: HTTP request count and duration, JDBC max/idle/active connection count, Tomcat session active/reject count.
- System: CPU system/process usage, OS System load, OS Process file count.
- JVM: GC pause count and duration, Memory max/used/committed size, Thread peak/live/daemon count, Classes loaded/unloaded count.